Research ops platform built by v0

From scattered insights to a product backlog driven by real user problems
Overview
Product Designer and Researcher across two product teams.
No research support. Weekly user tests, continuous discovery, and a growing volume of findings with nowhere reliable to live, until I built a system to fix that.
Problem
Prioritisation defaulted to stakeholder opinion rather than user evidence, because nothing was traceable.
Running weekly unmoderated tests across two product teams with no research support means a constant flow of findings and a constant risk of losing them. Insights lived across spreadsheets, decks, and session notes with no consistent structure. Patterns were invisible. Recurring pain points looked like one-off feedback. And because nothing was traceable, prioritisation defaulted to stakeholder opinion rather than user evidence.
The more research I ran, the worse it got. The process itself became the bottleneck.
Goal
One source of truth for all research, especially frequently reported pain points — that is fast to update, easy to synthesise, and directly connected to product decisions.
- Centralise all findings in one place that’s fast to search, scan, and revisit across studies.
- Make adding and editing frictionless, low enough overhead to sustain a weekly research cadence alone.
- Stay extensible, built to evolve as I discover what’s missing, not locked into a rigid structure from day one (e.g., an Excel sheet).
Solution | a lightweight research ops platform
Built with v0 and Supabase. Designed around how synthesis actually works, fast capture, pattern detection across studies, and prioritisation tied to participant reach rather than recency or gut feel.
Built with V0
and using Supabase for storing the data.
Key Features
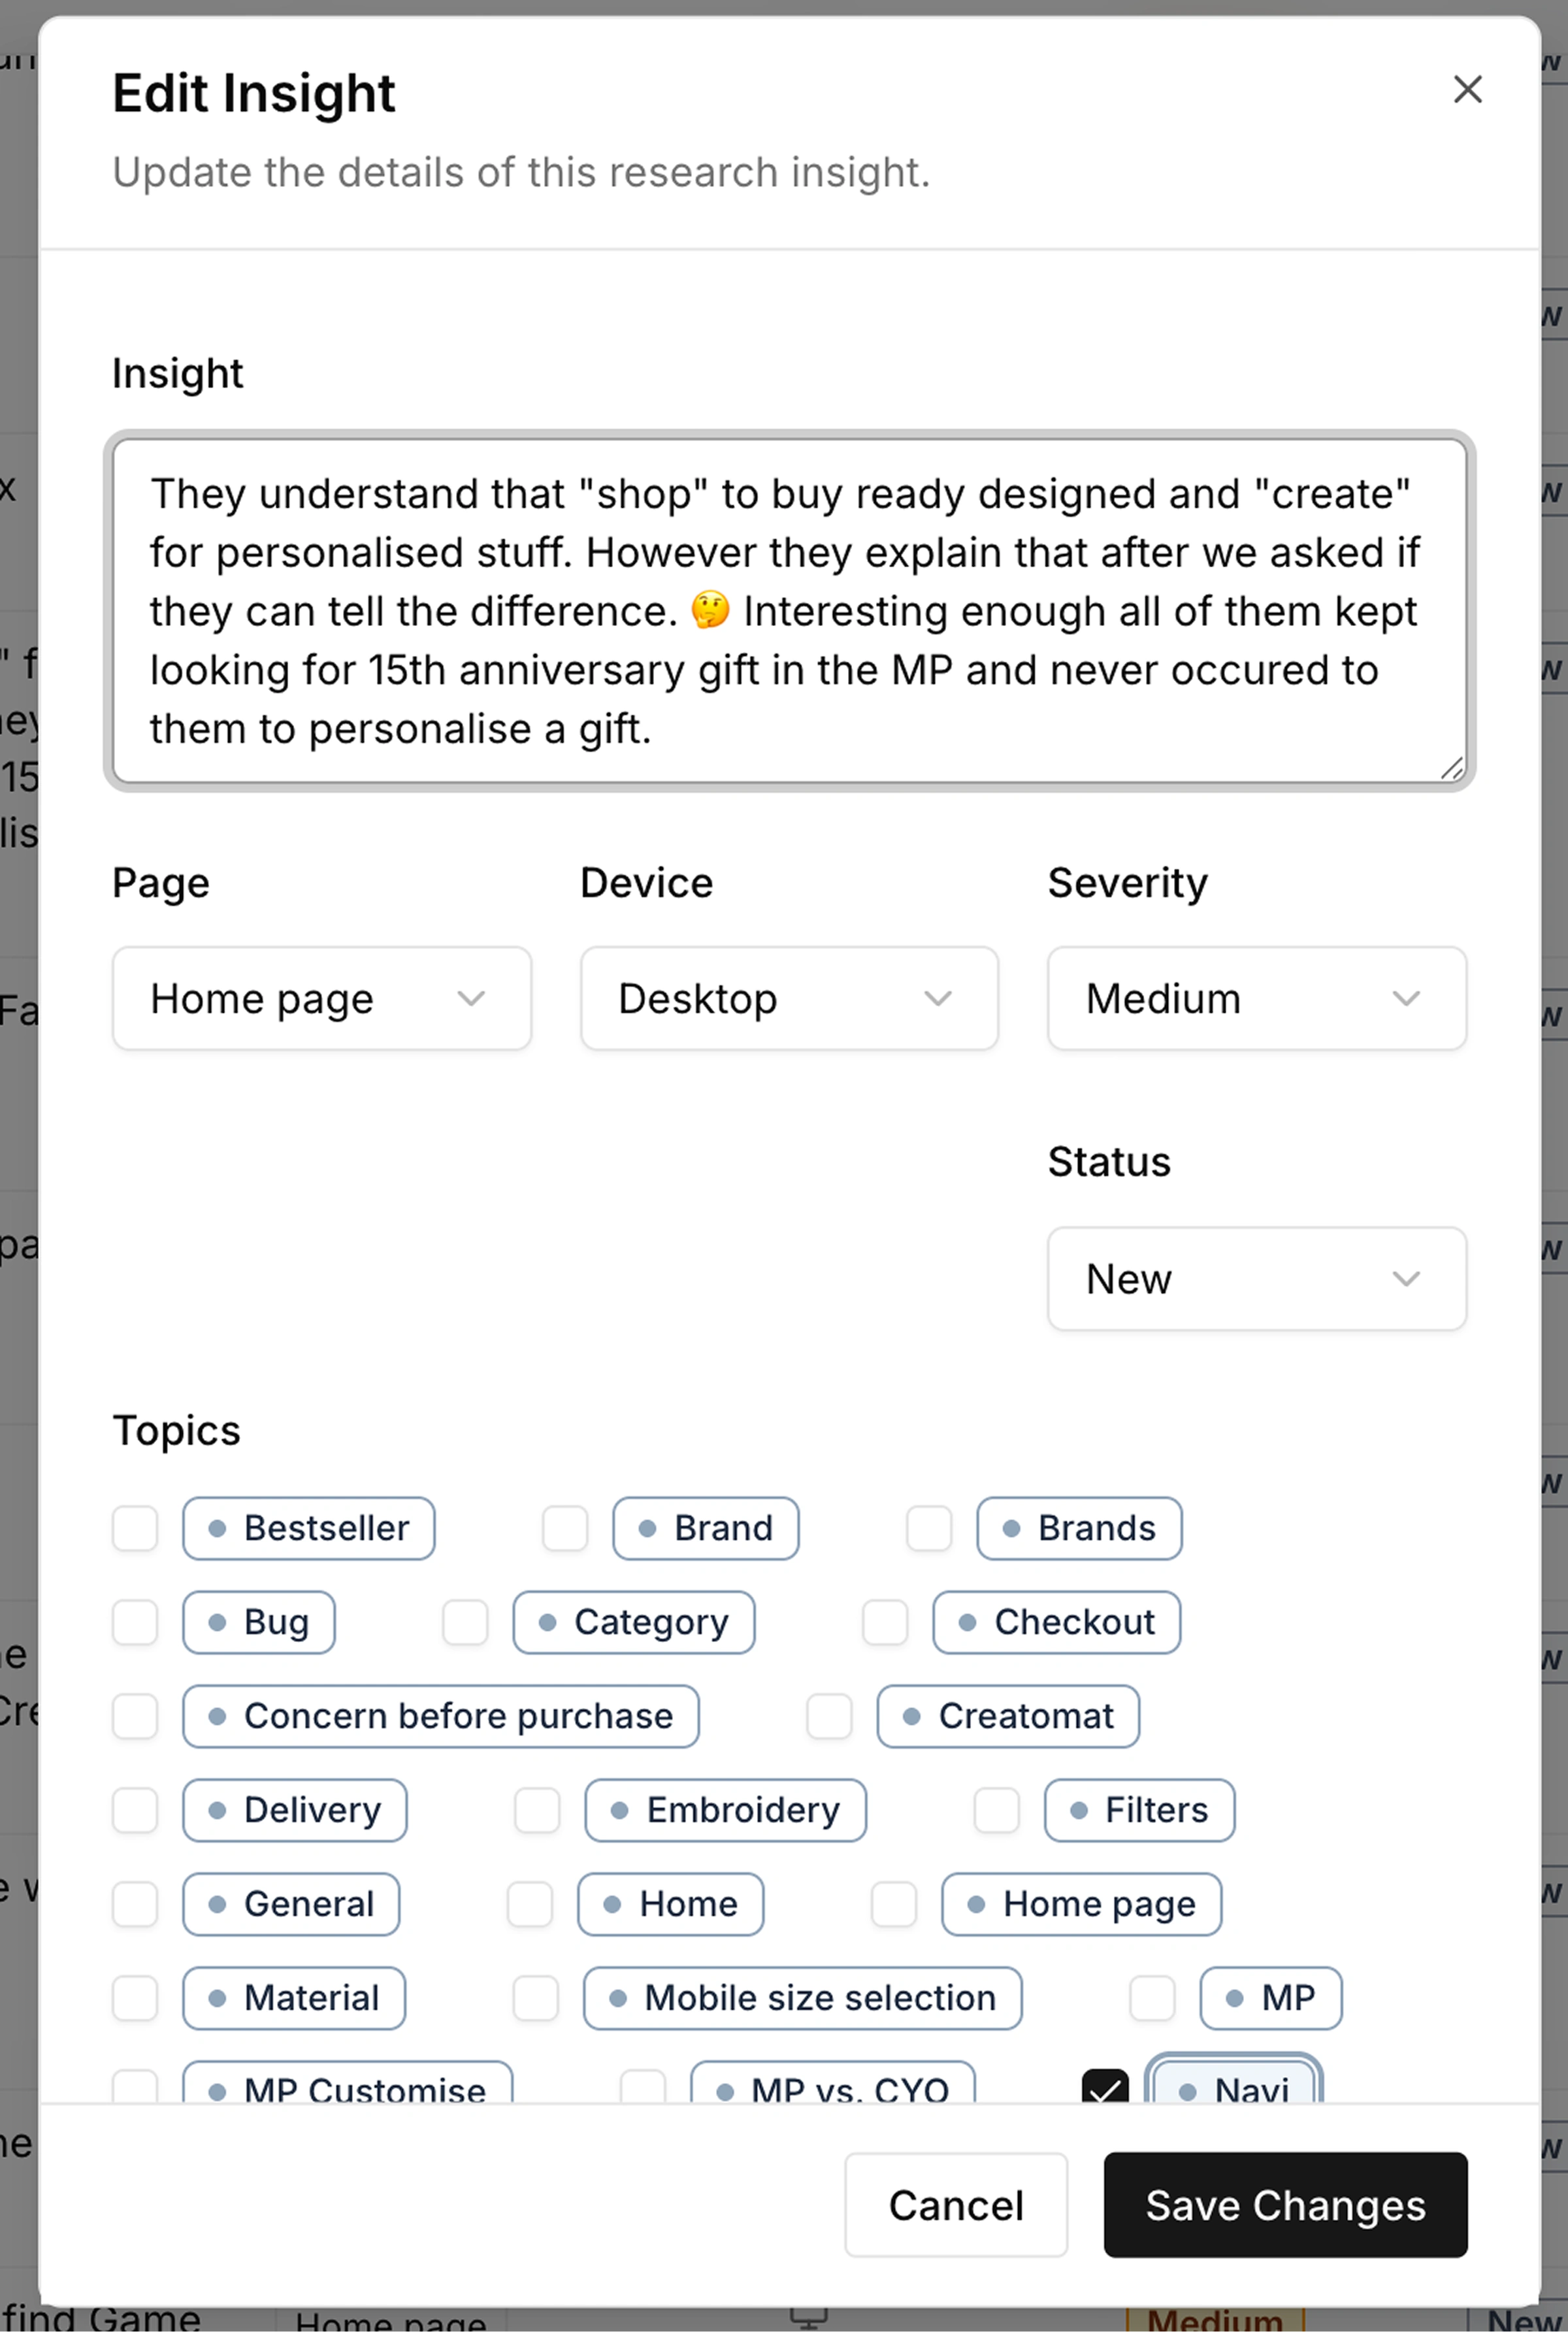
Insight capture
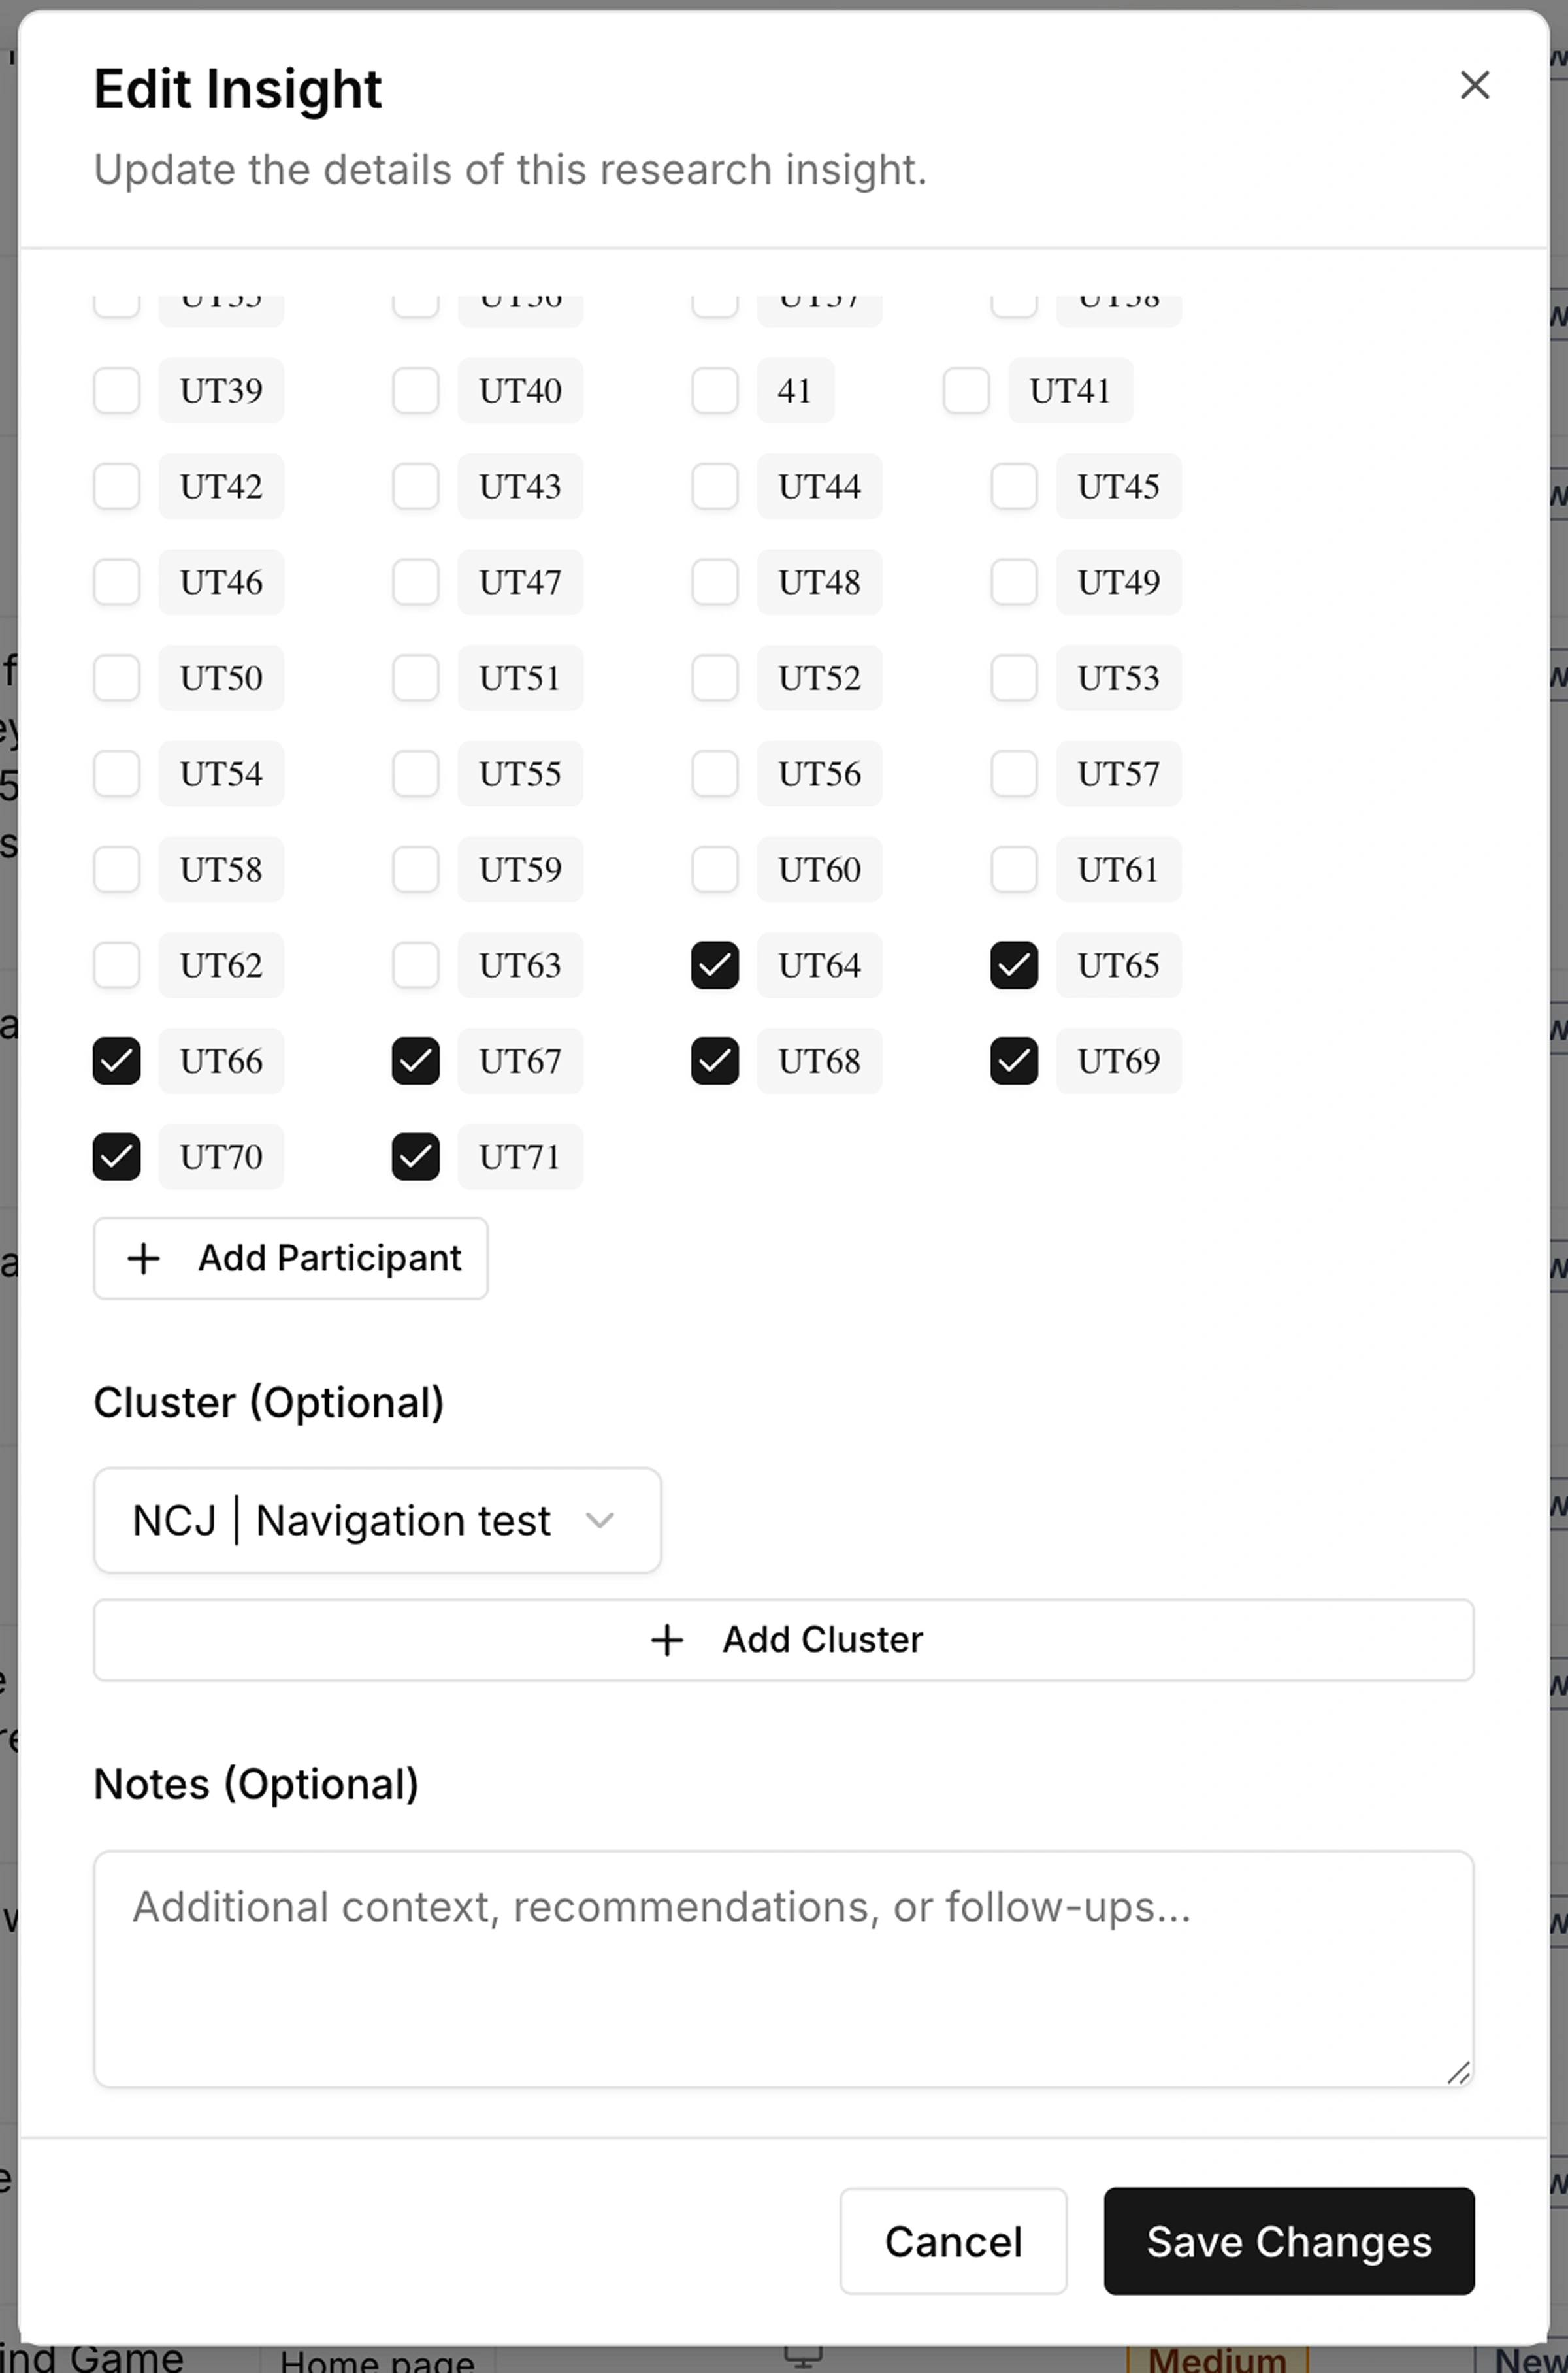
Create, tag, and annotate findings linked to participants, pages, devices, and severity.
Participant reach ranking
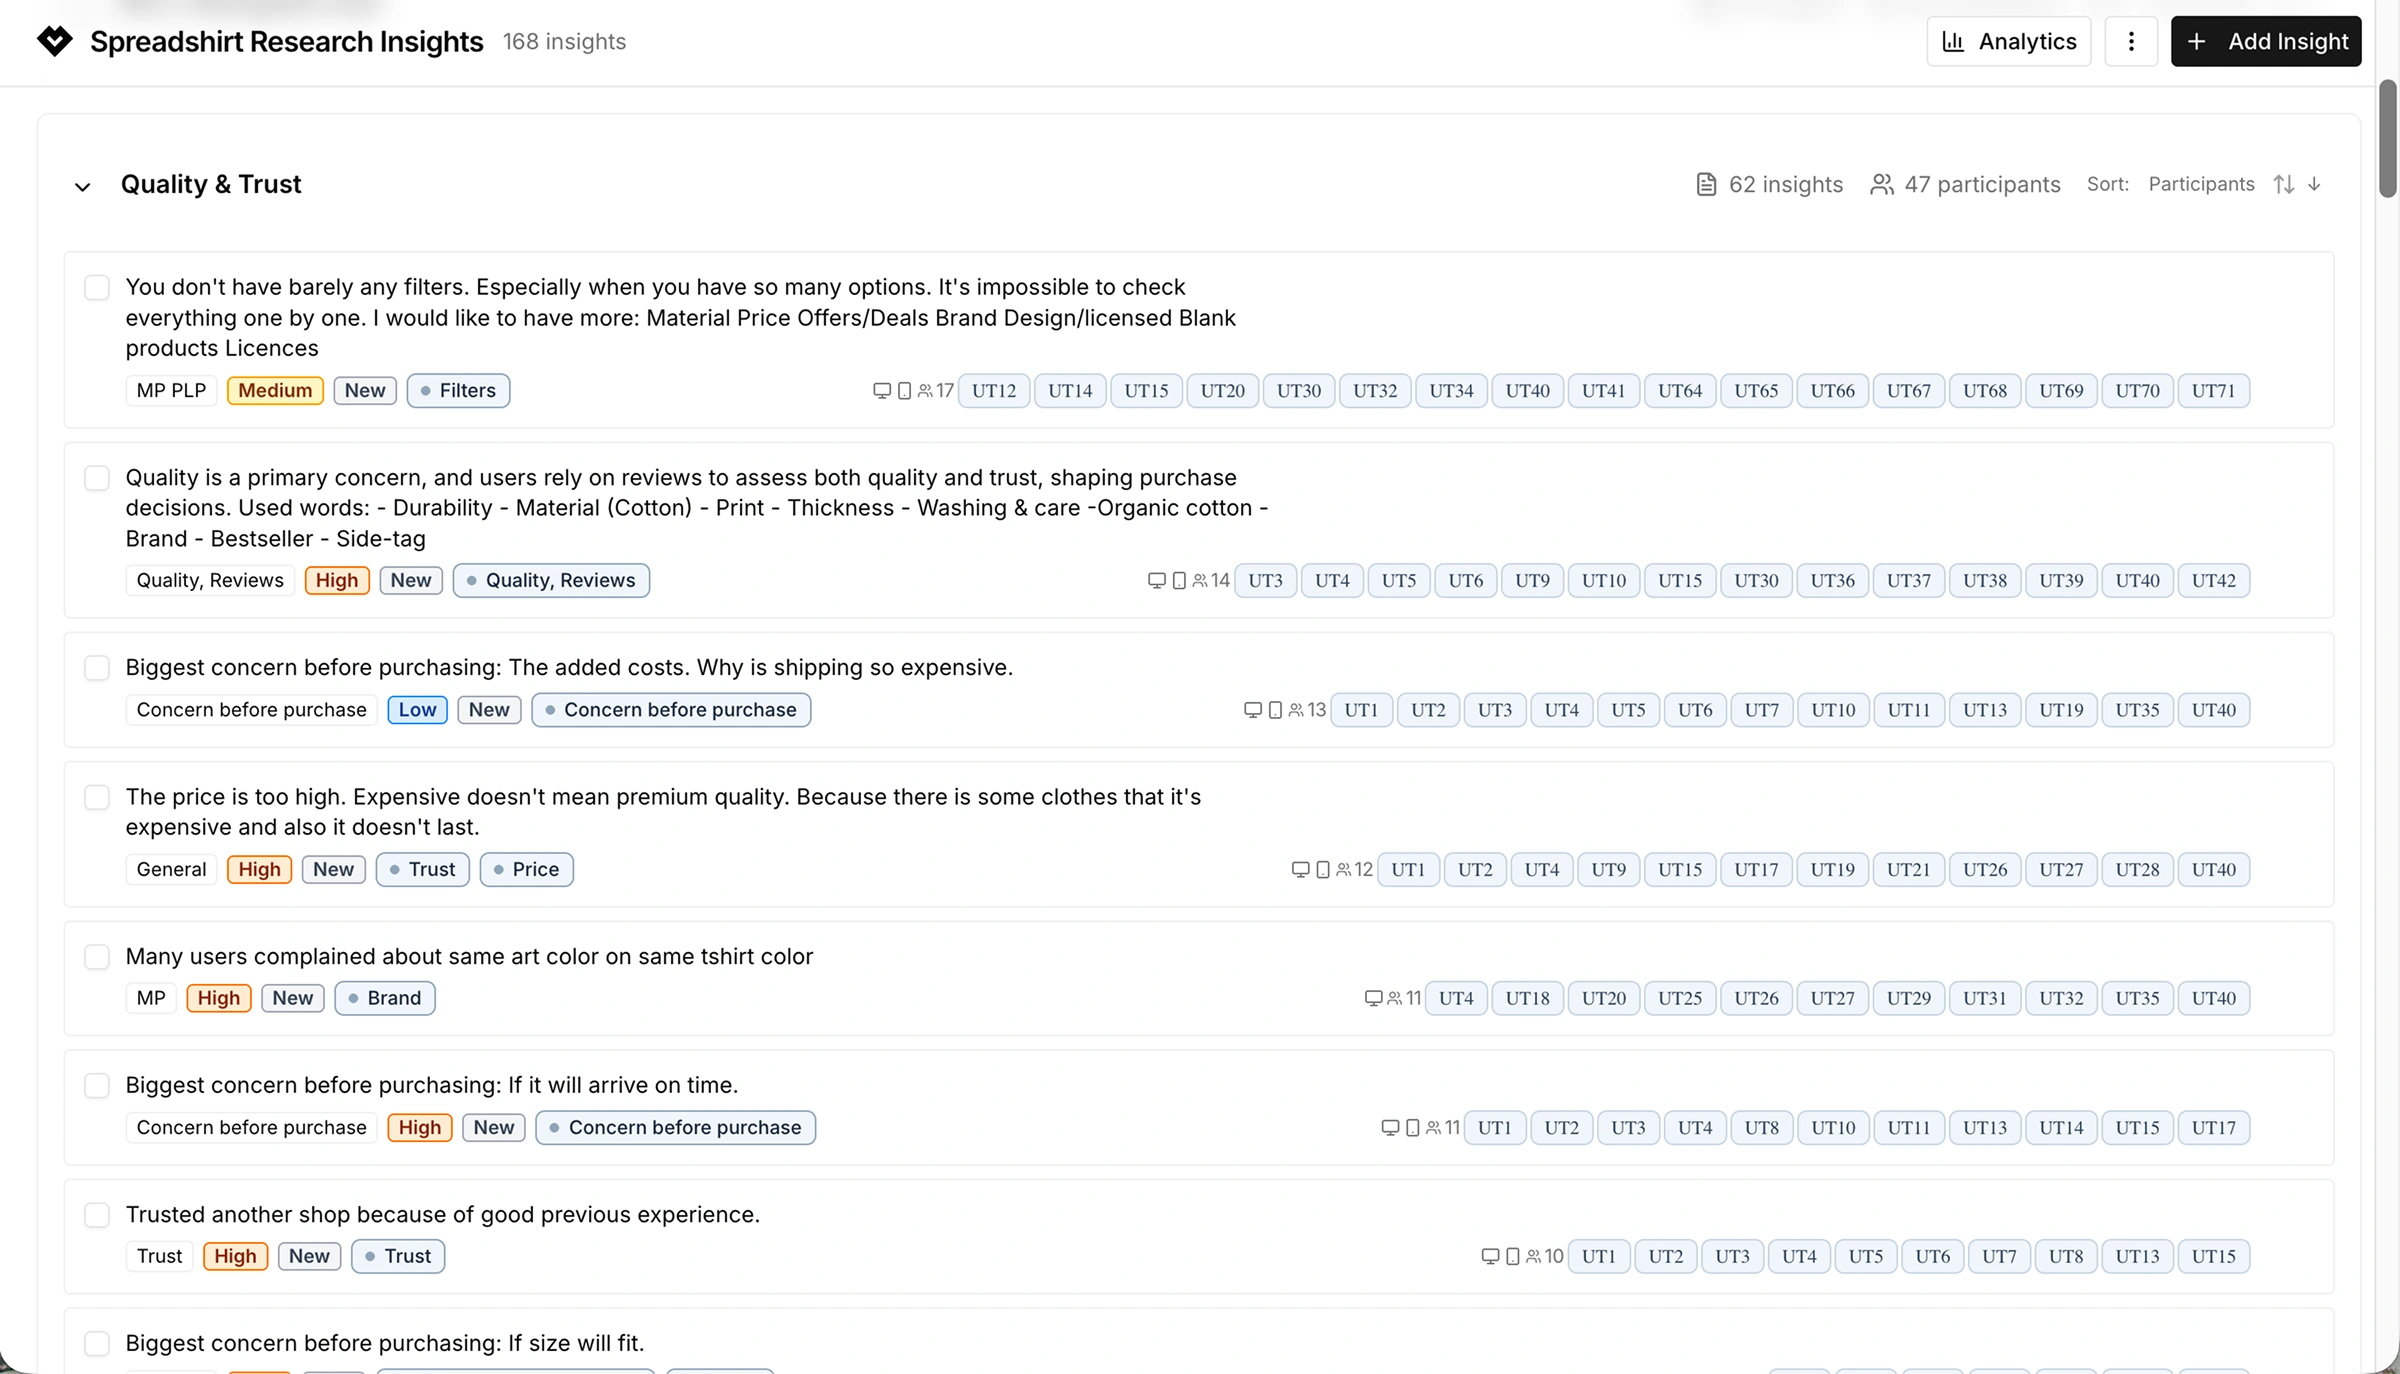
Insights ranked by how many users raised them. Turns “interesting feedback” into “18 out of 20 users hit this.”
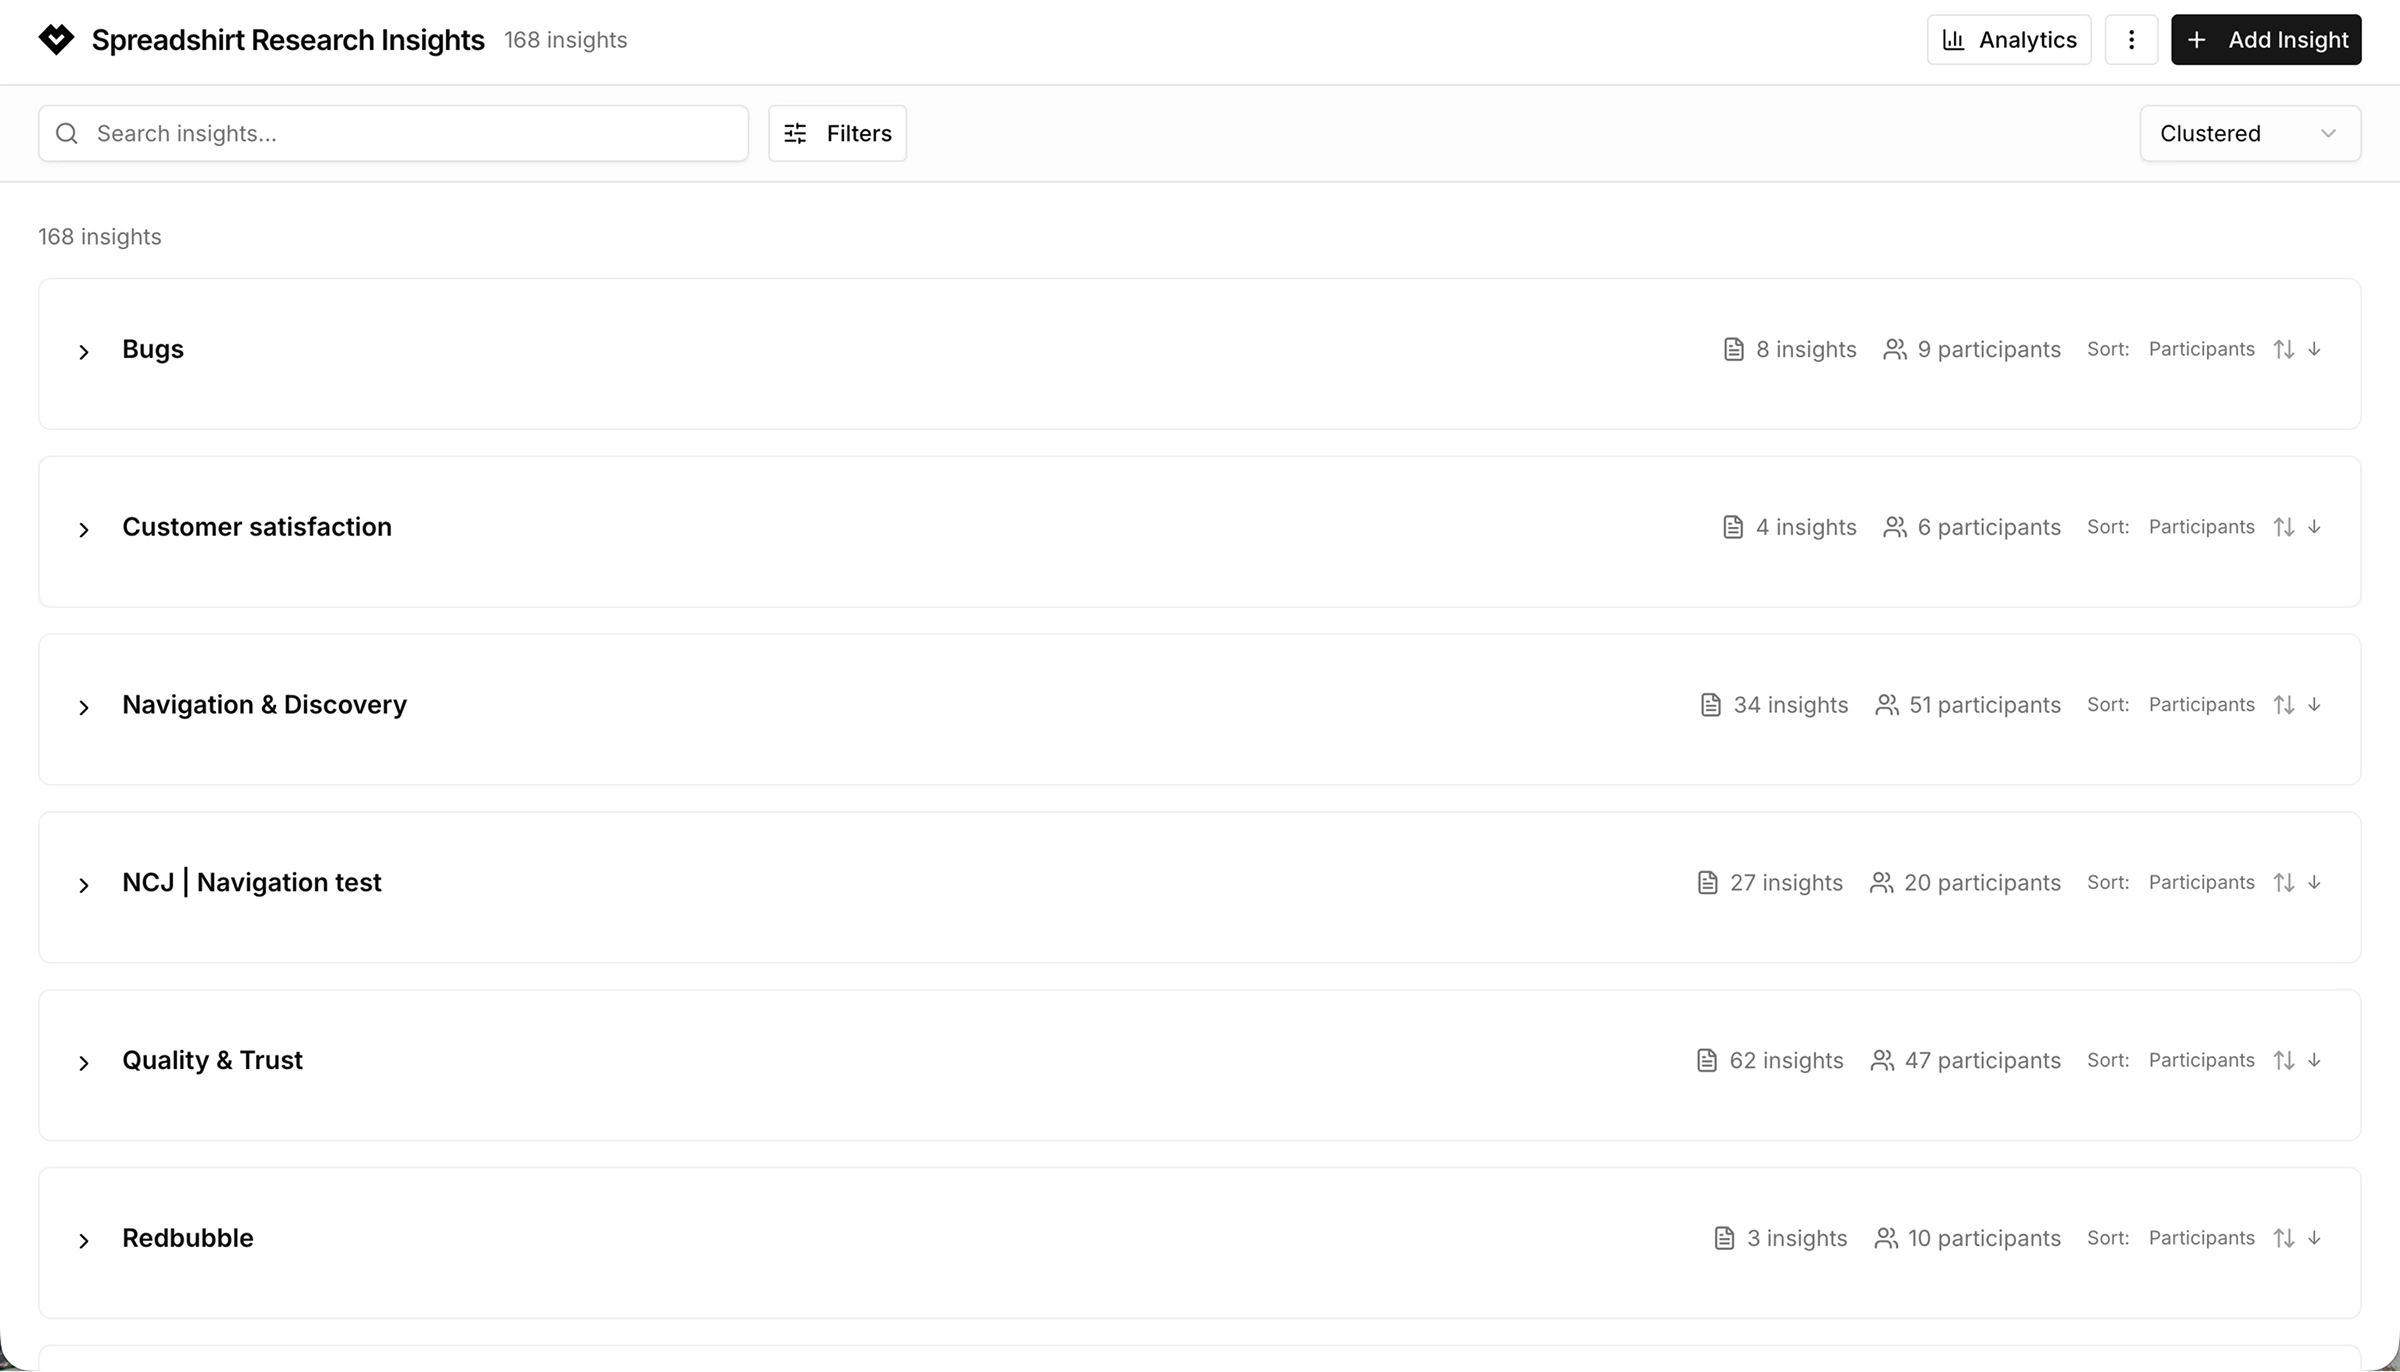
Dynamic clustering
Group insights into evolving themes. Clusters update as more research comes in.
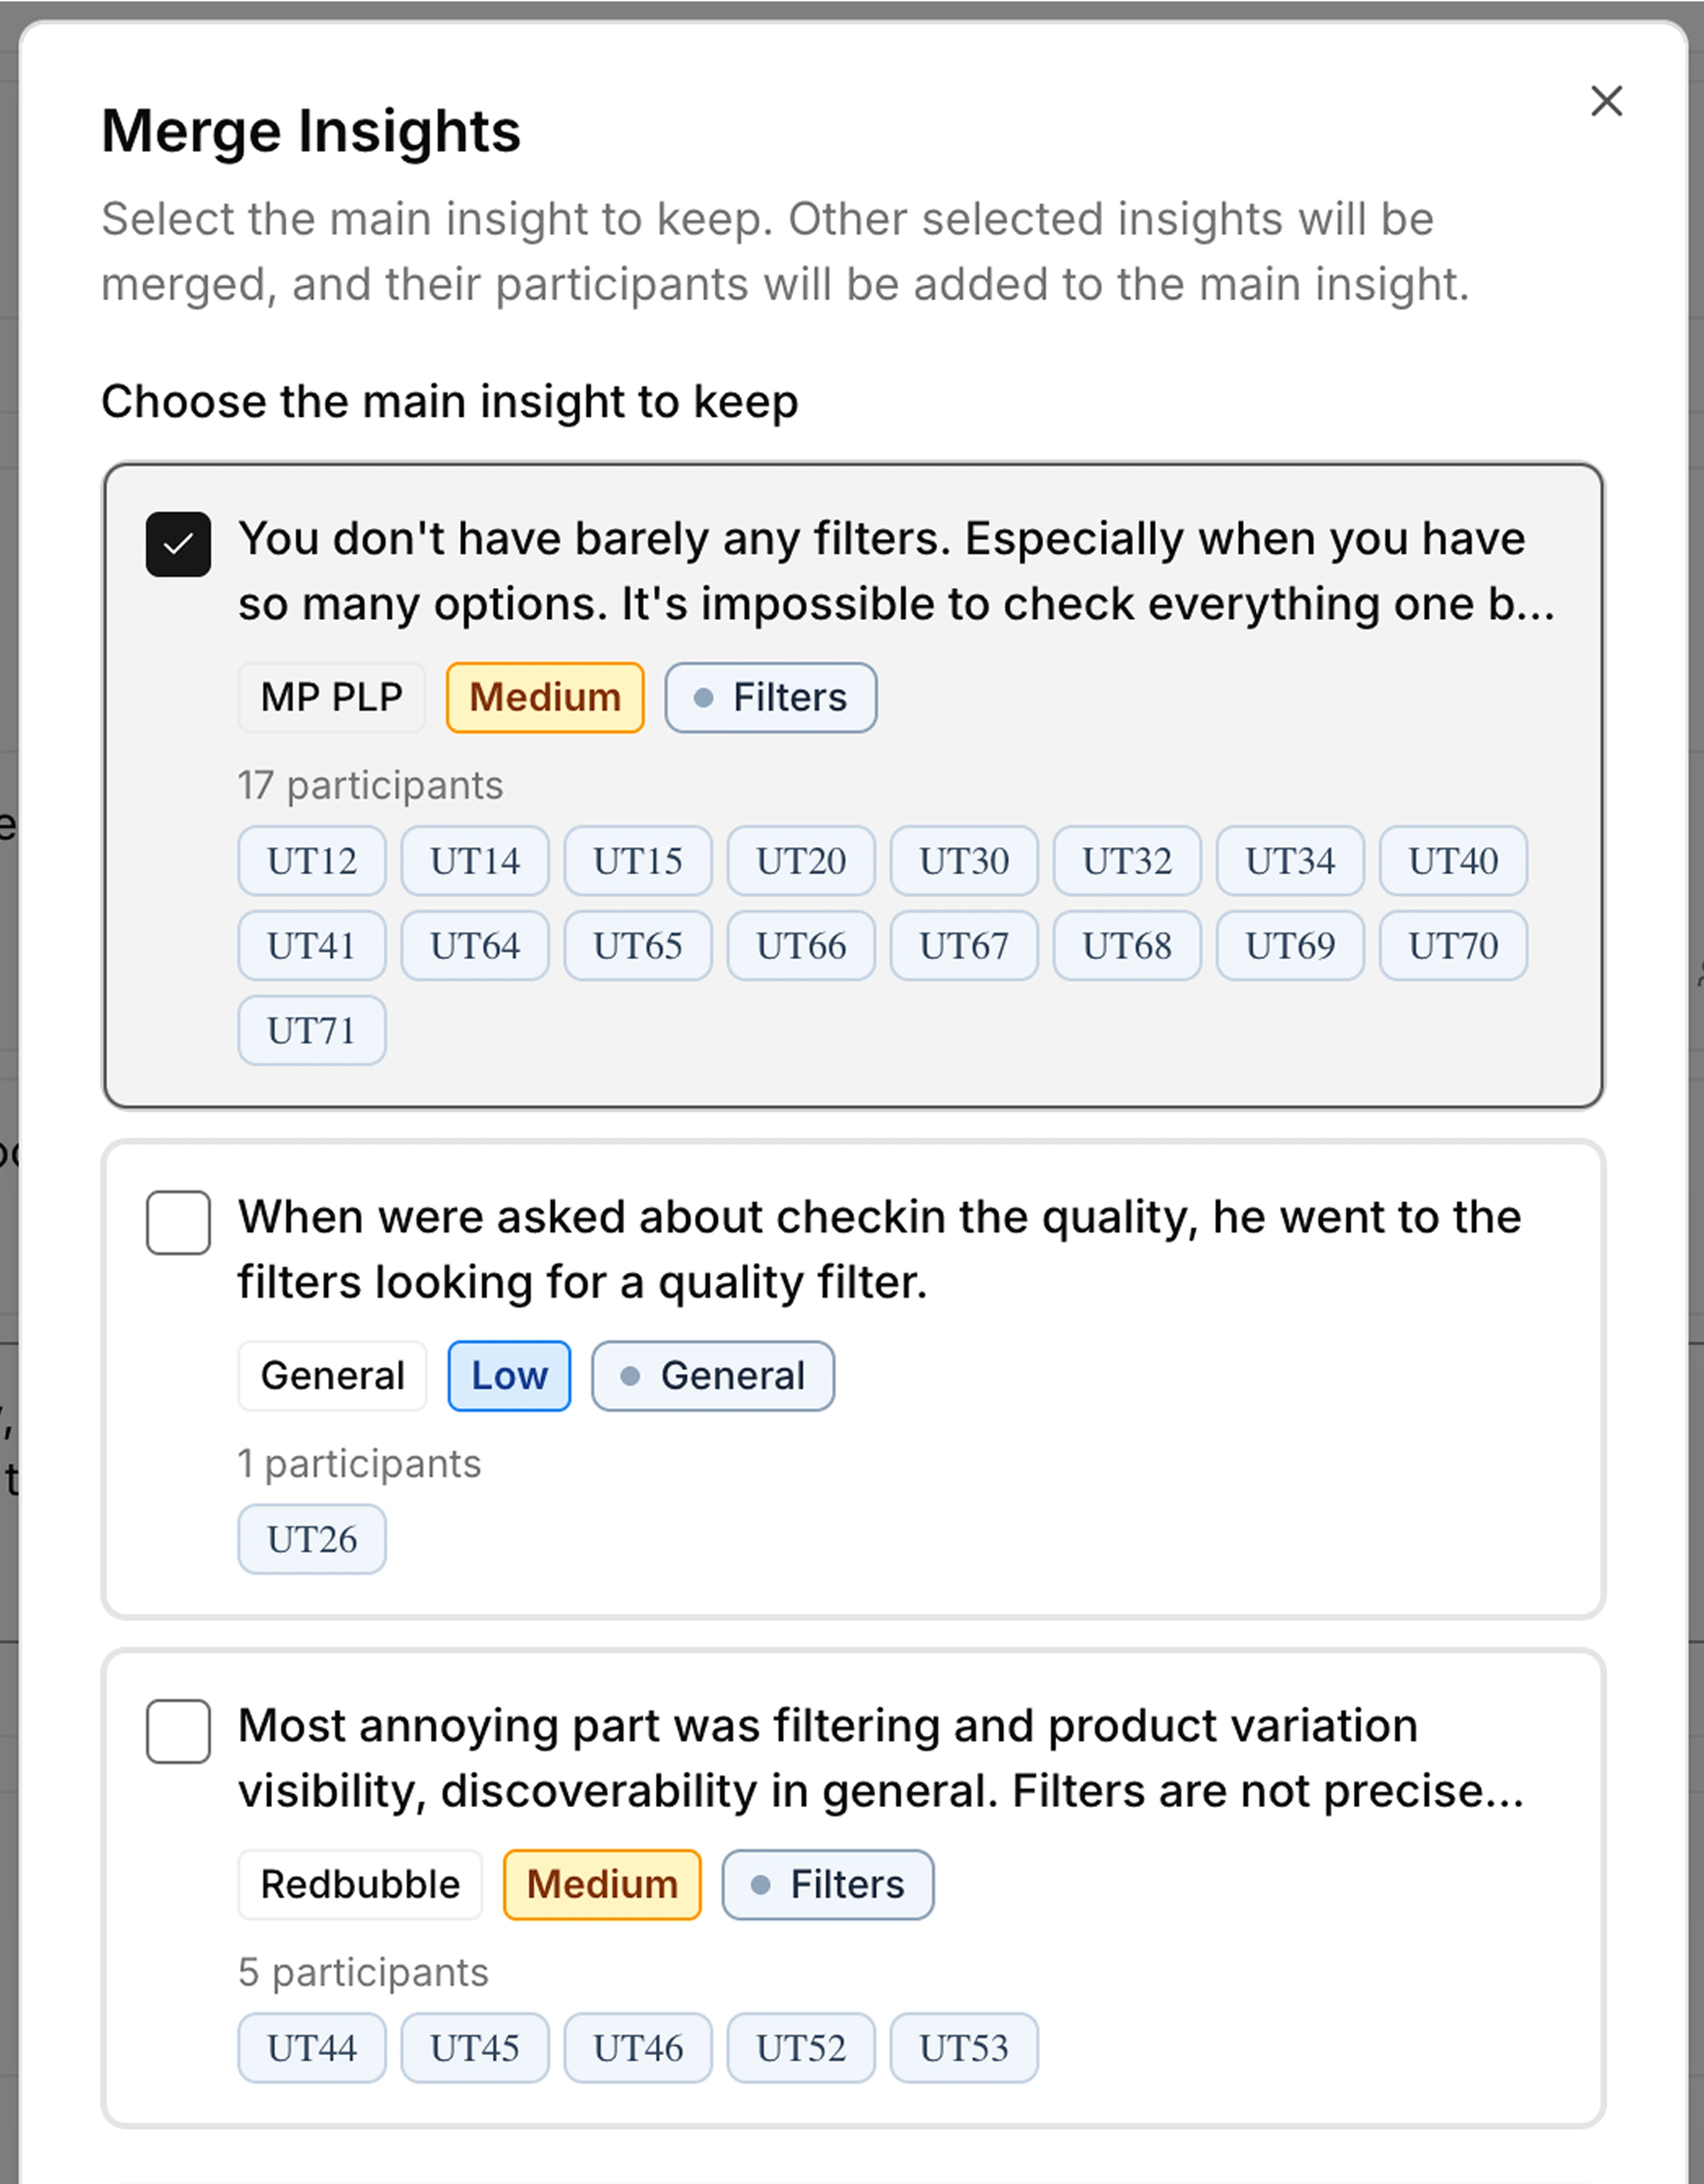
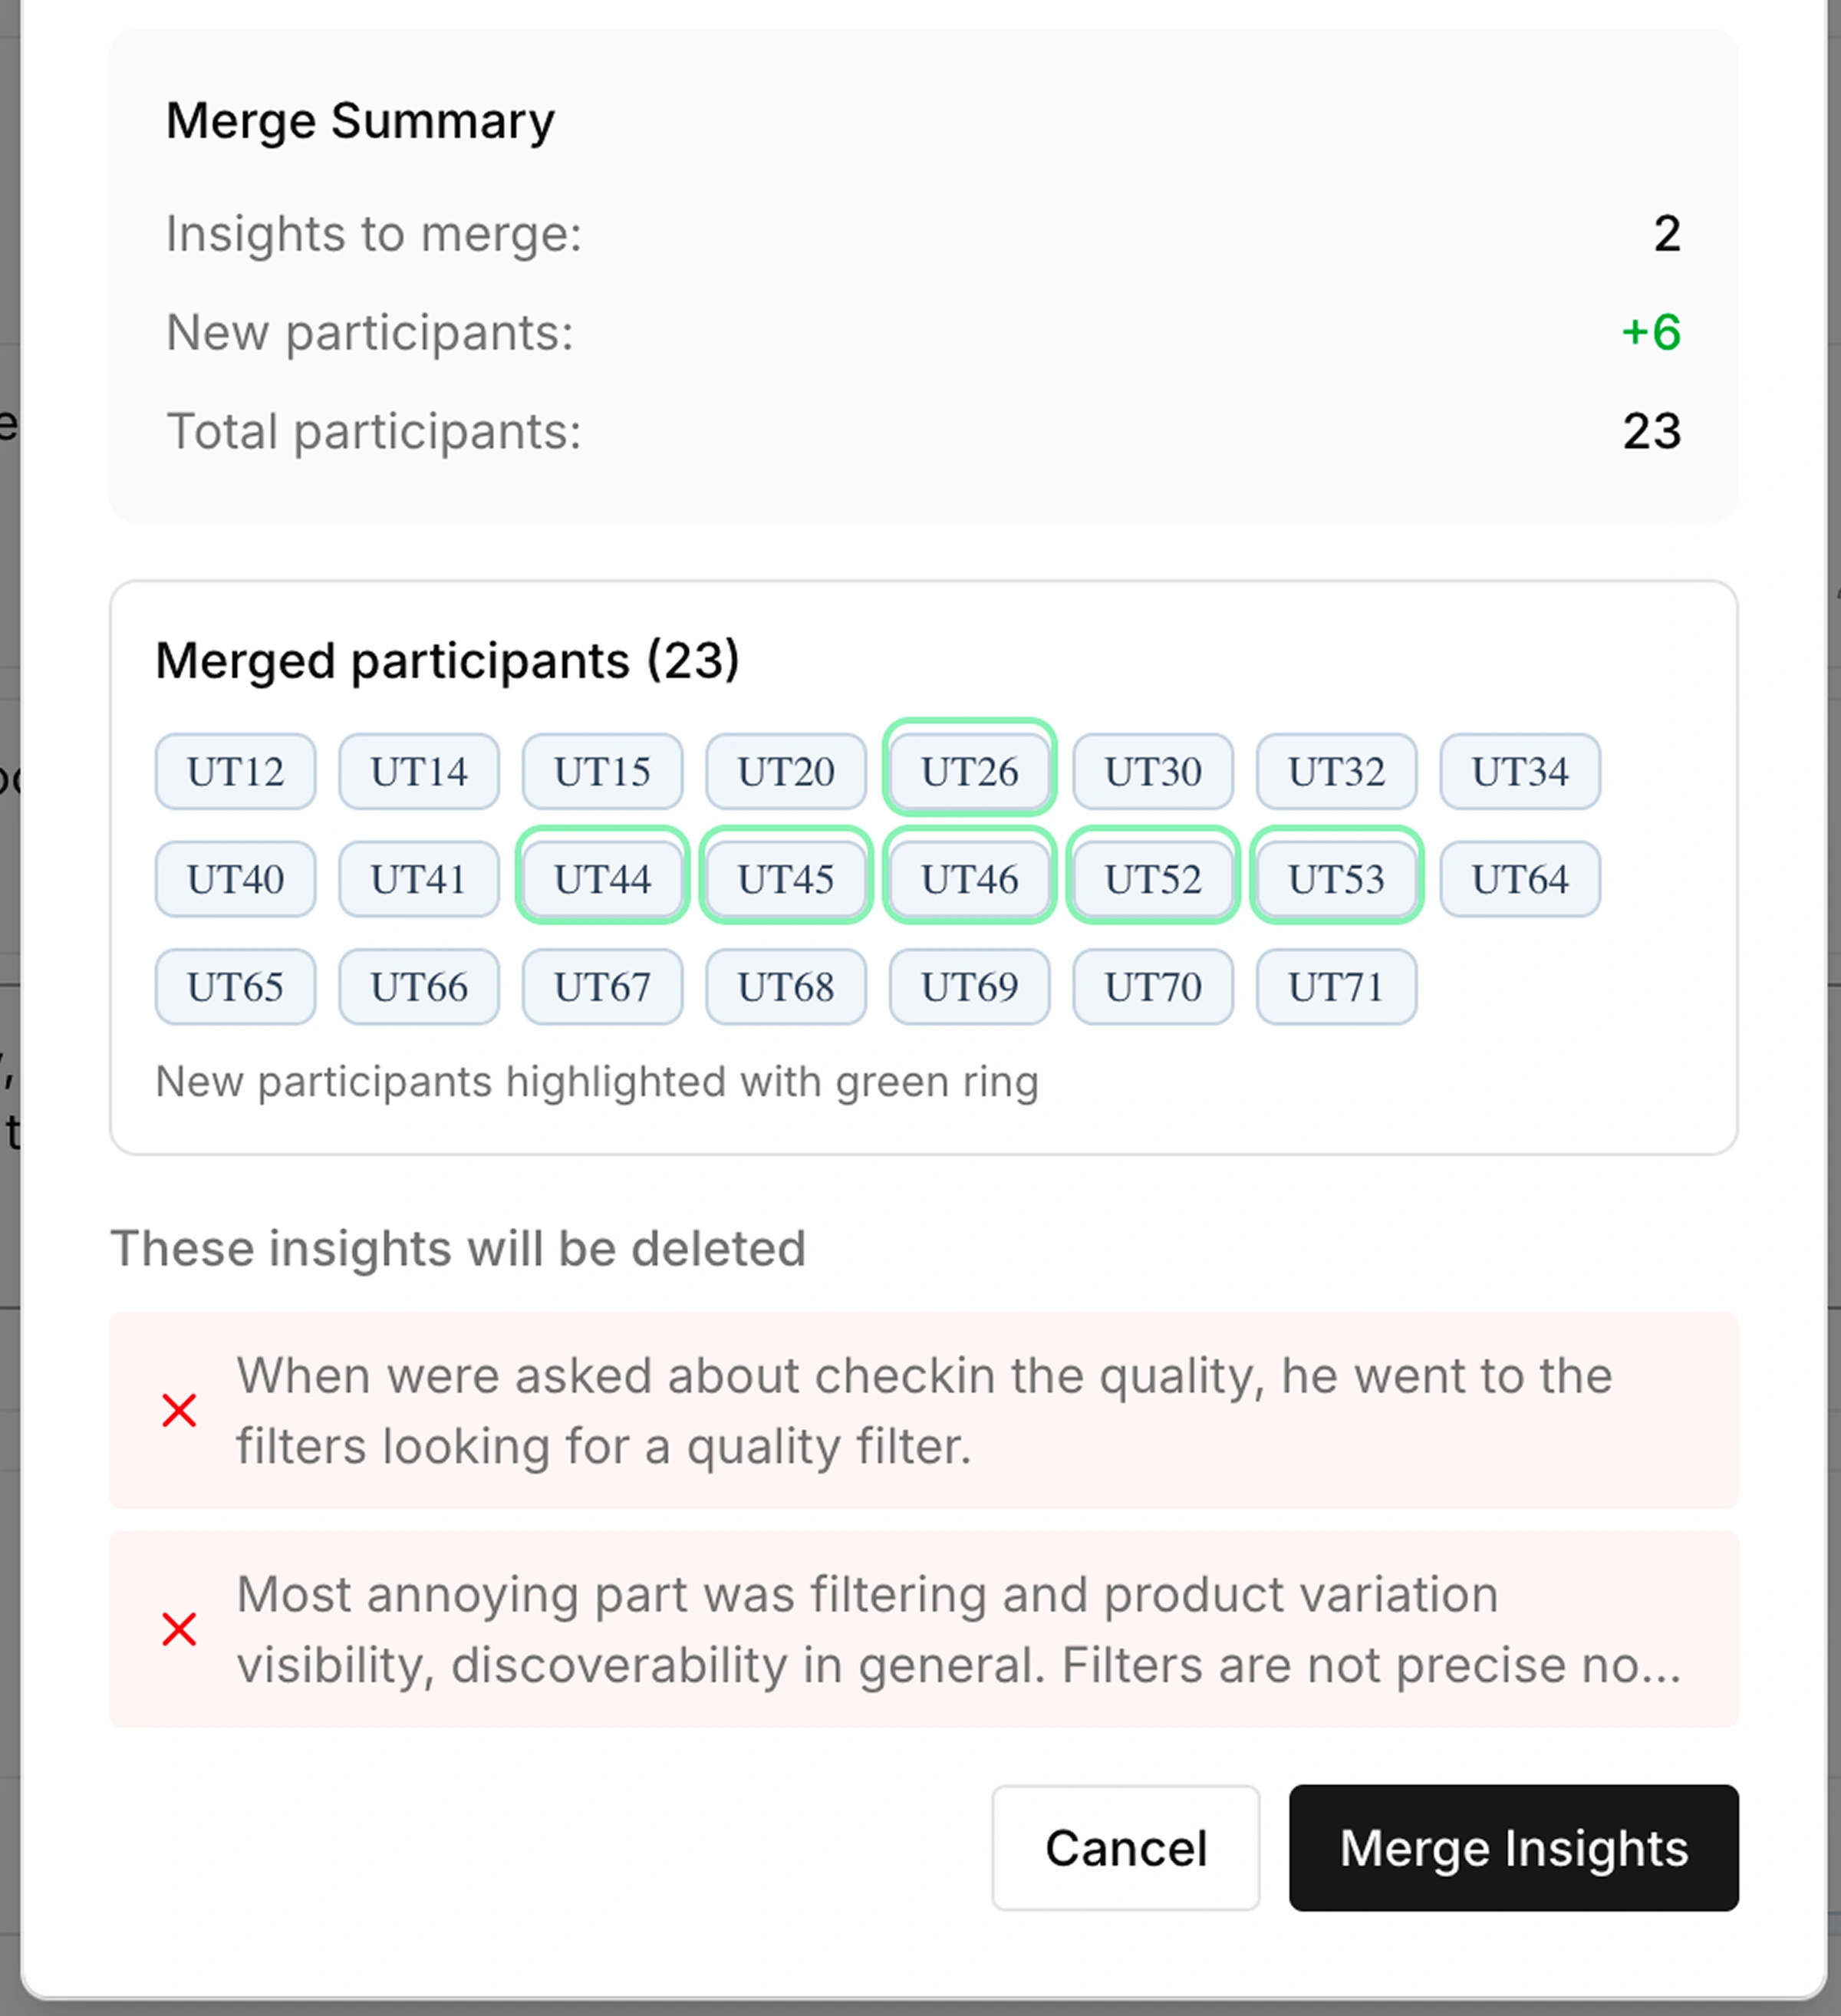
Insight merging
Merge duplicates across studies without losing participant relationships or traceability.
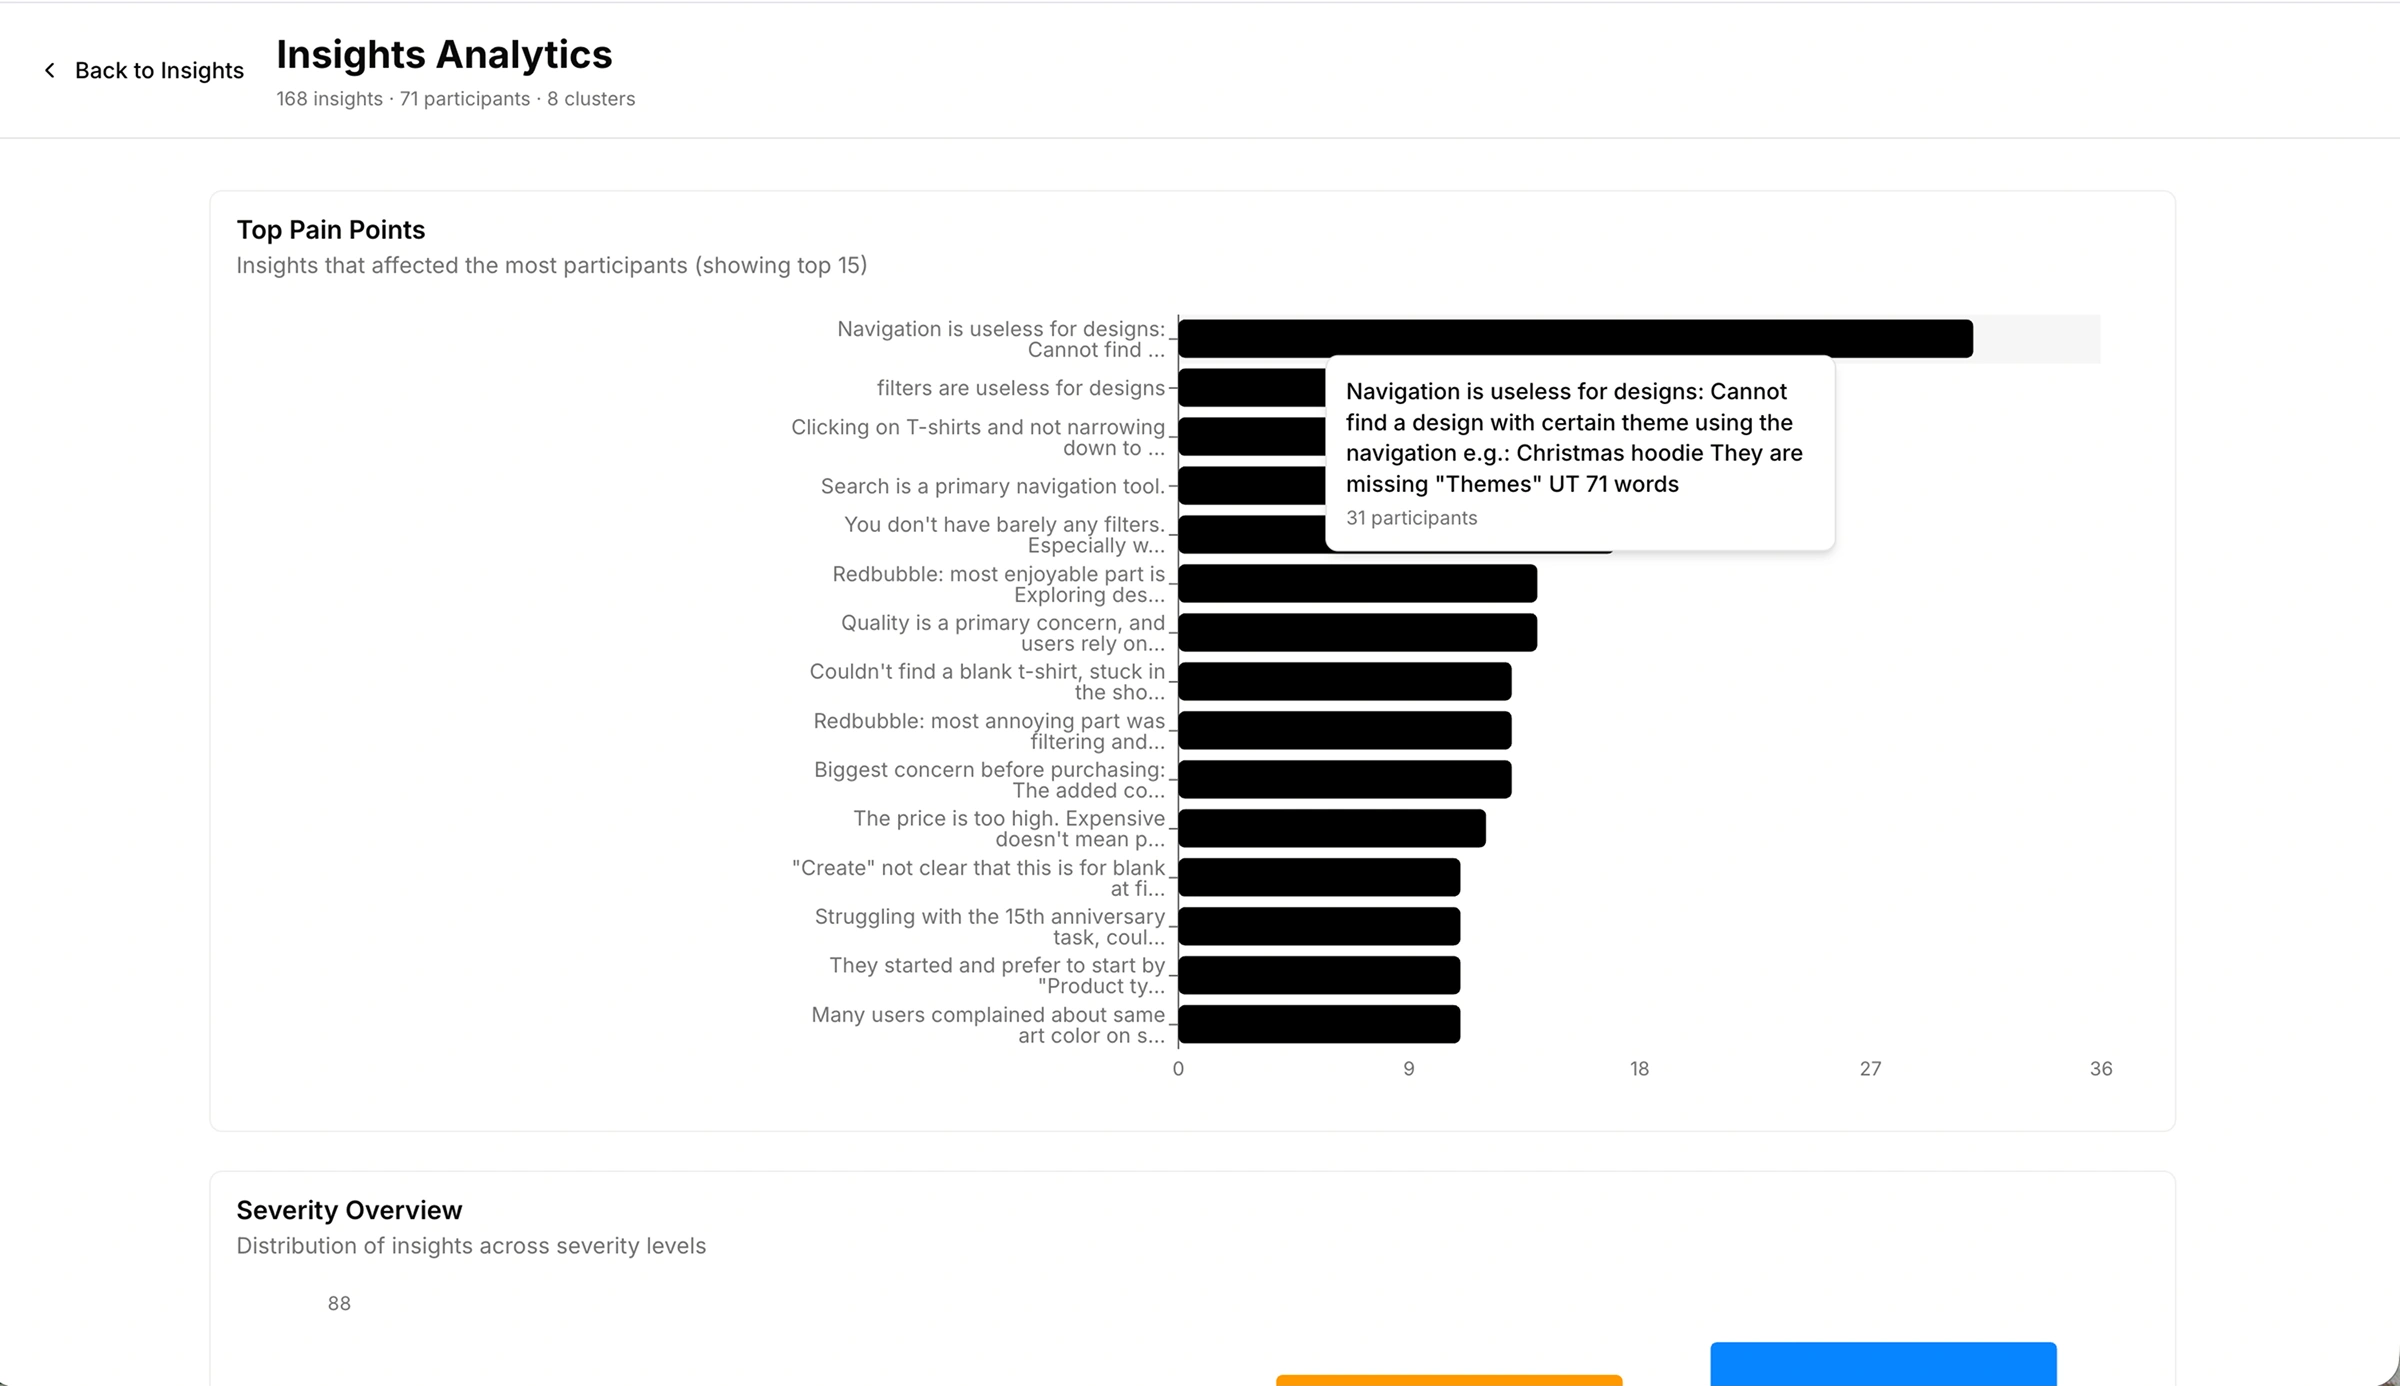
Analytics view
Severity distribution, cluster impact, and top pain points, all ranked by participant reach.
Impact | findings that shipped
The platform is referenced in sprint planning. Three of the top findings is surfaced are directly shaping the next OKR tertial, this is the clearest proof that centralising research created real business value.
Navigation & discovery
Designs and licensed products are impossible to filter, search, or find
Solution → Design themes integration on PLP, 3-level navigation menu (topic hub model), and search optimisation for licensed products.
Shipping cost
One of the biggest concerns before purchasing
Solution → Research evidence moved this from a known complaint to a business negotiation. Stakeholders are now working toward free shipping, something never previously offered.
Quality & trust
Users can’t assess product quality before purchasing
Solution → Product properties defined from research (material, fit, feel, fabric thickness, durability) being built into PDP and PLP as quality signals: in content, visuals, and filters.
The platform has already been adopted by other teams.
And the platform has already been adopted by other teams.
Planned improvement for the research ops platform
The platform currently shows participant counts against the total pool (168 insights, 71 participants across all studies). Navigation insights, for example, show 18 participants, but those were tested with a dedicated cohort of 20, making it an 18/20 finding. Scoping participant counts per study cluster is a planned improvement.
Scoping participant counts per study cluster is a planned improvement.
Reflection
This project pushed me beyond traditional design responsibilities, into data modelling, workflow architecture, and research operations. But the more important learning was about where design impact actually lives, not in the tool itself, but in what it makes possible. Insights that used to disappear after each study are now cumulative, traceable, and directly connected to product decisions.
Research value isn’t lost during researchIt’s lost during synthesis. Fixing that gap is where the real product impact is.